|
Arctic and Antarctica
Reference:
Fedorov V.M., Frolov D.M., Zalikhanov A.M.
Evaluation of the ice data based on the annual insolation in the upper boundary of the atmosphere
// Arctic and Antarctica.
2021. ą 4.
P. 1-14.
DOI: 10.7256/2453-8922.2021.4.37136.2 URL: https://en.nbpublish.com/library_read_article.php?id=37136
Evaluation of the ice data based on the annual insolation in the upper boundary of the atmosphere
Fedorov Valerii Mikhailovich
PhD in Geography
Leading Scientific Associate, the faculty of Geography, M. V. Lomonosov Moscow State University; Laboratory of Geoecology of the North and Laboratory of Latest Sediments and Paleography of Pleistocene
119991, Russia, g. Moscow, ul. Leninskie Gory, 1, of. 1904B

|
fedorov.msu@mail.ru
|
|
 |
Other publications by this author
|
|
Frolov Denis Maksimovich
Scientific Associate, Faculty of Geography, M. V. Lomonosov Moscow State University
119991, Russia, g. Moscow, ul. Leninskie Gory, 1, of. 1904B
|
|
denisfrolovm@mail.ru
|
|
 |
Other publications by this author
|
|
|
Zalikhanov Alim Mikhailovich
PhD in Geography
Senior Scientific Associate, Research Laboratory of Renewable Energy Sources, the faculty of Geography, M. V. Lomonosov Moscow State University
119991, Russia, g. Moscow, ul. Leninskie Gory, 1
|
|
bulungu@yandex.ru
|
|
 |
|
DOI: 10.7256/2453-8922.2021.4.37136.2
Received:
18-12-2021
Published:
27-01-2022
Abstract:
This article examines the reliability of ice data presented in the HadISST1 database (Hadley Centre Sea Ice and Sea Surface Temperature data set) of Hadley Meteorological Center (Hadley Centre for Climate Prediction and Research, Met Office, UK). The criterion for the reliability of HadISST1 database on the Northern hemisphere serves the average multiyear annual course of insolation in the Northern Hemisphere and the average multiyear annual course of insolation in 5-degree latitudinal zones at the upper boundary of the atmosphere, phase-shifted by two and three months to the past. It is revealed that the representative criterion for assessing the reliability of the business database is the average multiyear course of insolation in 5-degree latitudinal zones shifted by two months to the past. Evaluation of the data array on the Northern Hemisphere on the basis of the selected criterion demonstrates the overall high reliability of ice data reflected therein. However, there are two areas that differ in the degree of reliability of the presented data: 1) pack, drift ice with high negative values of the correlation coefficient; 2) coastal zone, in which the correlation is virtually absent (shore ice and flaw leads). The weak (or absent) correlation is observed over a significant length of the coastal zone in the Arctic Ocean, as well as in the straits and bays of the Canadian Arctic Archipelago. It is established hat the correlation coefficient of the annual course of the ice flow in the cells of the array of size 1 with the annual course of insolation of the Northern Hemisphere and the corresponding 5-degree latitudinal zones increases from the past to the present. This indicates the need for the correction of ice data in the early time range of the array (1901–1978), which precedes the time of the beginning of satellite observations.
Keywords:
sea ice, changing the area, insolation of the Earth, insolation contrast, Arctic seas, The Arctic, Arctic Ocean, insolation, atmosphere, Earth
As a criterion for the reliability of the HadISST1 ice data, the average long-term annual course of insolation in 5-degree latitudinal zones at the upper boundary of the atmosphere, phase-shifted by two months in the past, is proposed. The evaluation of the data for the Northern Hemisphere based on the selected criterion showed an increase in the reliability of sea ice area data from the past to the present, as well as high reliability of data for drifting (pack) ice and very weak reliability for soldered ice (coastal zones of the Arctic Ocean). It is determined that the vast area in the central Arctic needs to refine the algorithms for interpolation, extrapolation and reconstruction of sea ice area data in the twentieth century before the start of satellite monitoring and, probably, in their correction.
Introduction
The spread of sea ice depends on many factors determined by geophysical processes. These are, first of all, air temperature and humidity, ocean surface temperature, cloud cover, river flow, albedo, sea currents, drift, etc. However, the basis of these factors, as well as circulation processes in the atmosphere and ocean, is solar radiation coming to Earth – the main source of energy for hydrometeorological processes. The consequence of the irregularity of the arrival in time and the uneven distribution of solar radiation in space are the mechanisms of heat exchange – "heat engine of the first and second kind" (Shuleikin, 1953), interhemispheric heat exchange, heat exchange between the ocean and the atmosphere. The consequence of the irregularity in the intake and distribution of solar radiation, as well as the heterogeneity of the components of the natural environment are the processes of radiation heat transfer and the formation of heat exchange mechanisms between the atmosphere, ocean and sea ice. This implies the importance of the radiation factor in the dynamics of the spread of sea ice and the need to determine the relationship between these variables at different time scales. The search for such connections seems relevant for improving the methods of reconstruction and forecasting the spread of sea ice. This is determined by the fact that the insolation (for the upper boundary of the atmosphere) is calculated based on the characteristics of the Earth's orbital motion both in the past and in the future (Berger, 1978; Borisenkov et al., 1983; Cionco, Soon, 2017; Fedorov, Kostin, 2019). In addition, there is probably a possibility of using radiation characteristics to refine the available arrays of temperature and ice data. The aim of the work is to investigate the possibility of assessing the reliability of the HadISST1 ice data array based on the insolation criterion on the scale of the annual course. The average long-term course of insolation was used as an evaluation criterion, which is closely related to the annual course of the sea ice area (Fedorov, 2015; Fedorov et al., 2020).
The HadISST1 array, containing data on the average monthly ocean surface temperature (TPO) and the area of sea ice for the entire Globe since the end of the XIX century to the present, can be the basis for studies of the current climate and dynamics of sea ice (climate indicators) with high spatial resolution and the forecast of their changes in the future. Also, this database can be used to refine models for predicting the dynamics of the sea ice area (Fedorov, Grebennikov, 2021). In this regard, the database of the sea ice distribution area has great scientific value. However, there are definitely disadvantages associated with the lack of initial data for some regions and time periods, as well as with methods of calculation and data interpolation. In this regard, the possibility of identifying areas and time ranges for which data need to be clarified seems to be an urgent geophysical task.
Object and methodology of research
The database of the Hadley Meteorological Center (Hadley Centre for Climate Prediction and Research, Met Office, UK) HadISST1 (Hadley Centre Sea Ice and Sea Surface Temperature data set) was used as the object of research (http://www.metoffice.gov.uk/hadobs/hadisst/data/download.html ). The information presented in the HadISST1 database on the average monthly temperature of the ocean surface and the area of sea ice in the Northern and Southern hemispheres was obtained as a result of combining into a single array of reanalysis data (ERA40) performed using empirical orthogonal functions (EOF) and instrumental (primarily ship and satellite) observations. The reconstruction of the sea ice area in the array according to grid 1° x 1° was carried out on the basis of algorithms for approximation and extrapolation of available data (digitized maps of the sea ice area, ship data and satellite observations) taking into account the ocean surface temperature (TPO) (Rayner et al., 2003). The array contains data on the average monthly area (concentration) of sea ice in spatial cell 1° x 1° as a percentage of the cell area, from 1870 to the present. In our work, we considered the period from 1901 to 2018 for the Northern Hemisphere. The array considered for the selected period covers about 7,400 cells in the Northern Hemisphere. Each cell contains information on the area (concentration) of sea ice with a monthly resolution. The array is completely filled with monthly values (there are no gaps). By monthly values, the average annual (as the average for all months of the year) and semi-annual (as the average for the months from April to September for the summer half-year and from October to March for the winter half-year) values of the sea ice area were calculated.
In this paper, the intra-annual dynamics of the sea ice area in the latitudinal range from 90° north latitude to 42° north latitude are analyzed. We have adopted the lower boundary conditions based on the characteristic 0.5% average annual value of the annual sea ice area in a cell at this latitude. At lower latitudes, the average long-term value does not exceed 0.5% of the cell area. For the range 42-43 north latitude the average long-term value of the area of cells occupied by sea ice exceeds 0.5% (0.556%). For the range of 41-42 north latitude, the average area of ice in the cell for the period from 1901 to 2018 is 0.278%. The distribution pattern remains the same for half-years and months, but the latitude range with cells in which the average ice area exceeds 0.5 varies. In the winter half-year, the parameters of the lower values of the sea ice area are identical to the annual values. In the summer half of the year at the parallel of 43 north latitude the average area occupied by ice for a cell is 1.389% of the cell area. Sea ice does not spread further south during this period. In March (the maximum in the spread of sea ice), the range of analyzed values (by the boundary value of 0.5%) is 90-42 north latitude, for September 90-54 north latitude (Fig. 1, 2). Thus, cells falling on water areas not covered by ice in the period from 1901 to 2018 were excluded. The ice data of the marked latitude and time ranges were used in the correlation analysis with the annual course of insolation.
Fig. 1. Distribution by geographical latitudes of the average long-term value for the period from 1901 to 2018 in March of the sea ice area in cell 1° x 1° (approximation is a polynomial of the fifth degree)
Fig. 2. Distribution by geographical latitudes of the average long-term value for the period from 1901 to 2018 in September of the sea ice area in cell 1° x 1° (approximation is a polynomial of the fourth degree)
The insolation for the upper boundary of the atmosphere (or the Earth's surface without taking into account the atmosphere) was calculated by us earlier with a large spatial and temporal resolution (Fedorov, Kostin, 2019; Fedorov, Frolov, 2019). The insolation calculations were performed according to the data of high-precision astronomical ephemerides (Giorgini et al., 1996; http://ssd.jpl.nasa.gov ) for the entire surface of the Earth (excluding the atmosphere) in the interval from 3000 BC to 2999 AD. The initial astronomical data for the calculations of insolation were the declination and ecliptic longitude of the Sun, the distance from the Earth to the Sun, the difference in the course of the uniformly current (coordinate time - CT) and the world corrected time (UT). The Earth's surface was approximated by an ellipsoid (GRS80 - Geodetic Reference System, 1980) with half-axis lengths equal to 6378137 m (large) and 6356752 m (small). The insolation (J) of the latitudinal zone of the earth's surface, bounded by the latitudes and, in the time interval is calculated by the general formula:
where σ(φ) is the area multiplier, σ(φ)d ad φ is the area (m2) of the cell (infinitesimal trapezoid) of the earth's surface, φ is the latitude (in radians) of the center of this cell, α is the hour angle of the Sun (in radians) corresponding to the center of the cell at time t , Λ (t ,φ,α) is the irradiation intensity (W/m2) of the cell in a small neighborhood of the moment t (c) on the scale of uniformly current time. The irradiation intensity (W/m2) is obtained by dividing the insolation in J by the duration of the time interval and the irradiation area. The integration steps were: in longitude 1°, in latitude 1°, in time 1/360 of the duration of the tropical year (Fedorov, 2002; Fedorov, 2013).
The value of the solar constant (the average long-term TSI value) was assumed to be 1361 W/m2 (Kopp, Lean, 2011). The change in solar activity was not taken into account (Fedorov, Kostin, 2019; Fedorov, Frolov, 2019). The insolation calculations are performed for the tropical year, half-year and months. The tropical year begins from the point of the vernal equinox (March 22 in 1901 and March 21 in 2018). The ice data in the HadIASST1 array is presented in months of the calendar year. We compared the tropical months with the calendar months in the following way: the 1st tropical month with the 4th calendar month of April, the 2nd with the 5th calendar month of May, etc. Then the average long-term monthly values of insolation shifted 2 and 3 months ago (Fig. 3, 4) to obtain the closest connections with an average long-term annual course of the area of sea ice in the cells of the array. At the same time, the months that went beyond the limits of the year were transferred to the beginning of the year. Thus, November becomes the first in the annual course with a shift of two months (Fig. 3), and with a shift of three months, October (Fig.4).
Fig. 3.The average long-term for the period from 1901 to 2018. The annual course of insolation of the Northern hemisphere (W / m2), shifted by two months in the past
Fig. 4. The average long-term for the period from 1901 to 2018. The annual course of insolation of the Northern hemisphere (W / m2), shifted three months into the past
The correlation between the average long-term annual course of insolation and the average long-term annual course of the sea ice area in each cell (1° x 1°) was calculated. At the same time, calculations were performed for three time ranges: 1901-2018, 1950-2018 and 1978-2018 (this period contains satellite observations). Within the selected time ranges, the correlation analysis of the average long-term annual course of the sea ice area in the cell was carried out first with the average long-term annual course of insolation of the entire northern hemisphere. Then the correlation analysis of the average long-term annual course of the sea ice area in the cell with the average long-term annual course of insolation in the 5-degree latitude zone to which cell (1° x 1°) belonged was also carried out. Calculations were carried out for two phase shifts of the average long-term annual course of insolation for 2 and 3 months in the past.
Possible errors in the correlation analysis are related to the chronological discrepancy of the calendar year, half-years and months for which there are values of the sea ice area with the tropical year, half-years and months for which the insolation characteristics were calculated. However, such errors, firstly, are small, and, secondly, have a systematic nature and do not affect the solution of the main task of assessing the reliability of the ice data array.
The evaluation and significance of the linear correlation coefficient when performing correlation analysis was determined in accordance with existing methods (Sachs, 1976). The standard error of the correlation coefficient is determined by the formula:
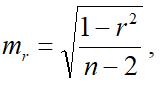
r - is the sample correlation coefficient; n - is the sample size. The statistical significance of the linear correlation coefficient is determined using the Student's criterion, the actual value of which is found by the formula:
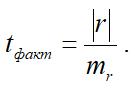
Conclusions about the materiality of r are made on the basis of a comparison of tfact and tkp(a;n - 2) the critical (tabular) value of the T -distribution, here a is the significance level, (n-2) is the number of degrees of freedom. The correlation coefficient is considered statistically significant if t fact > T kr is performed. Otherwise, it is statistically insignificant.
The results of the research and their discussion
Earlier, we obtained close links between the annual course of the sea ice area in the Northern Hemisphere as a whole and the annual course of insolation. Estimates of such a relationship for individual seas are also obtained (Fedorov et al., 2020). In this paper, the stability of the connection of the annual course of the sea ice area with the most important rhythm in the nature of the Earth on the scale of cells 1 is evaluated and the possibility of using the annual course of insolation as a possible criterion for the quality and reliability of the ice data array is investigated.
1. Analysis of the correlation of the average long-term course of the Northern hemisphere insolation and the average long-term course of sea ice in cells 1° x1°.
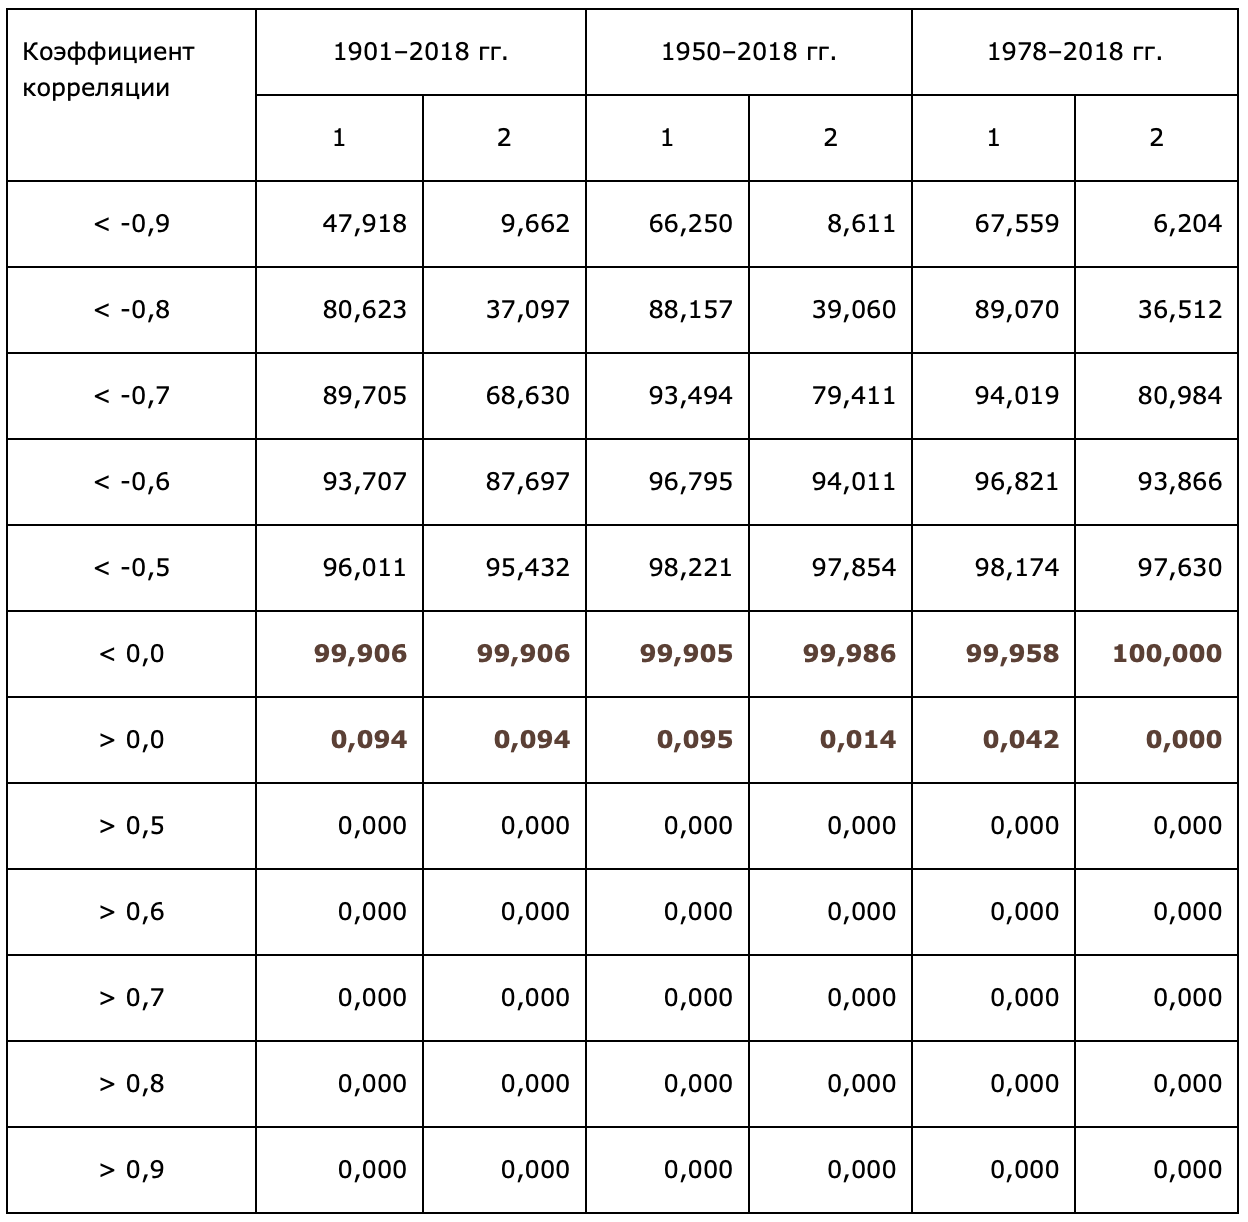
For the averaging period from 1901 to 2018 and with the annual course of insolation shifted by 2 months into the past, the average value of the correlation coefficient (R) for all cells of the Northern Hemisphere was -0.781. The average value of negative R was -0.783, positive 0.101. When the annual course of insolation was shifted three months into the past, the corresponding values turned out to be -0.733, -0.734 and 0.130. When averaging the annual course of insolation and the annual course of the sea ice area for the period from 1950 to 2018, the average value of R for the Northern Hemisphere in the array with a shift of the annual course of insolation by 2 months in the past was -0.822 (with a shift of 3 months -0.759). The average value of negative R turned out to be -0.824 (with an offset of -0.760 by 3 months in the past). The average value for positive R turned out to be 0.188 (with a shift of the annual course of insolation by 3 months in the past – 0.035). When averaged over the period of satellite observations (1978-2018), the average array value of R for the Northern Hemisphere is -0.833 and -0.758 with a shift in the annual course of insolation by two and three months, respectively. The average negative values of R are -0.833 and -0.759, positive 0.183 and 0.026, respectively. For all time ranges of averaging, negative values of R exceed 99%, which confirms the overall high consistency of the data array (Table 1, Fig. 5).
Table 1. Distribution of values of the correlation coefficient (%) of the average long-term annual course of insolation of the Northern Hemisphere (for the periods 1901-2018, 1950-2018 and 1978-2018) and the area of sea ice in the Northern Hemisphere (1 - displacement of the annual course of insolation by 2 months in the past, 2 - displacement of the annual course of insolation by 3 months in the past)
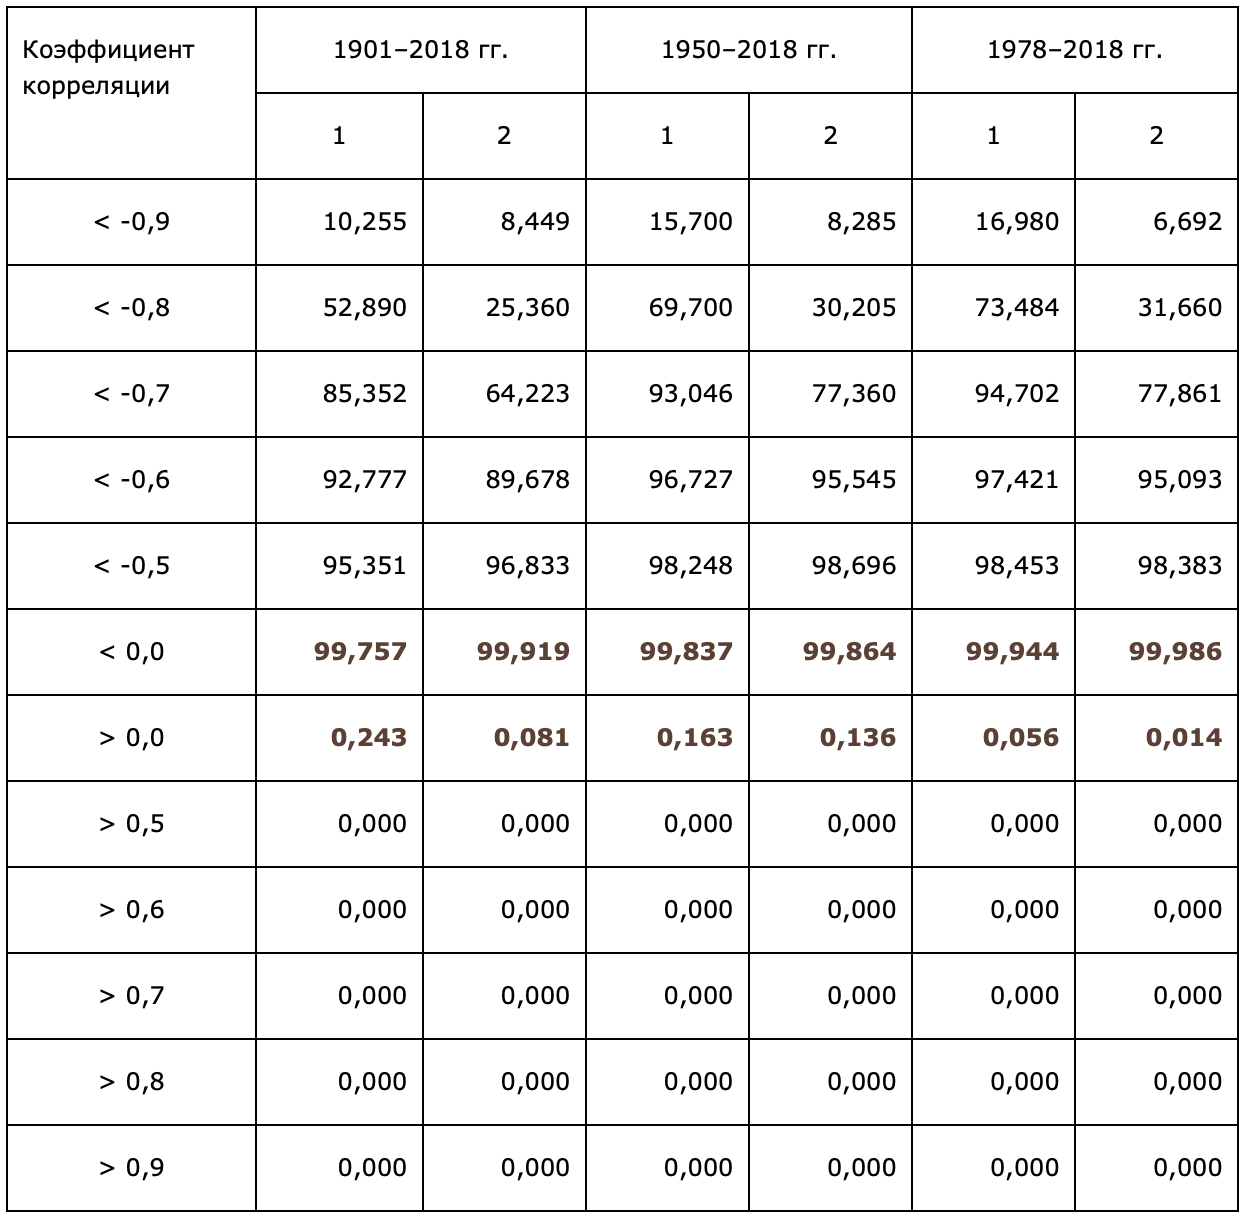
When correlating series containing 12 monthly values, R modulo 0.5 is statistically significant with a probability of 0.90. The correlation coefficient modulo 0.6 is statistically significant with a probability of 0.95, equal to 0.7 - with a probability of 0.98. With R modulo 0.8, statistical significance is characterized by a probability of 0.99.
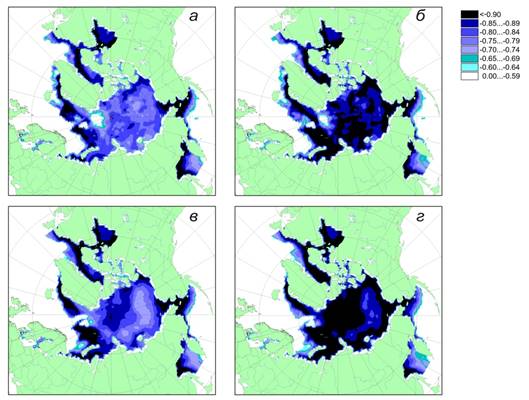
Fig. 5. Distribution of the correlation coefficient of the average long-term annual course of insolation of the Northern hemisphere and the average long-term course of the sea ice area for the period from 1901 to 2018 (a), for the period from 1978 to 2018 (c) with a two-month shift in the past; distribution of the correlation coefficient of the average long-term annual course of insolation in 5-degree latitude zones and the average long-term course of the sea ice area for the period from 1901 to 2018 (b), for the period from 1978 to 2018 (d) with a two-month shift in the past.
In the case of a shift of the annual course of insolation by two months into the past, the correlation is closer than with a shift of three months. So, for example, the number of values of R < -0.7 with an offset of two months exceeds the number of corresponding values of R with an offset of the annual course of insolation for three months in the averaging range of 1901-2018 by 1,329 times, in the range of 1950-2018 by 1,203 times, in the range of 1978-2018 by 1,216 times. Also, the values of R increase from the averaging range of 1901-2018 to the range of 1978-2018. When the annual course of insolation is shifted by two months, the number of values R < -0.7 obtained for the averaging range of 1978-2019 exceeds the corresponding number for the ranges of 1950-2018 and 1901-2018 by 1,018 and 1,110 times, respectively. When the annual course of insolation is shifted by three months, these values are 1,006 and 1,212, respectively.
2. Analysis of the correlation of the average long-term course of the northern hemisphere insolation in 5-degree latitudinal zones and the average long-term course of sea ice in 1° x 1° cells.
For the averaging period from 1901 to 2018 . and when the annual course of insolation of the corresponding 5-degree latitude zone was shifted 2 months into the past, the average value of the correlation coefficient (R) for all cells of the Northern Hemisphere was -0.852. The average value of negative values of R turned out to be -0.853, positive 0.125. When the annual course of insolation was shifted three months into the past, the corresponding values turned out to be -0.744, -0.745 and 0.235. When averaging the annual course of insolation and the annual course of the sea ice area for the period from 1950 to 2018 . the average value of R in the array for the Northern Hemisphere when the annual course of insolation is shifted by 2 months into the past is characterized by a value of -0.891 (with a shift of 3 months -0.766). The average value of negative R values is -0.892 (with an offset of 3 months in the past -0.766). The average for positive values of R is 0.224 (when the annual course of insolation is shifted 3 months into the past – 0.025). When averaging over the period of satellite observations (1978-2018), the average array value of R for the Northern Hemisphere is determined by the values -0.899 and -0.743 when the annual course of insolation is shifted by two and three months into the past, respectively. Accordingly, the average negative values are -0.900 and -0.743, positive 0.130 with an offset of two months in the vulgar. When the annual course of insolation is shifted in the corresponding 5-degree cells for three months in the past, positive values are not recorded. For all time ranges of averaging, negative values of R exceed 99% (Table 2). Table 2. Distribution of values of the correlation coefficient (%) of the average long-term annual course of insolation of 5-degree latitude zones of the Northern Hemisphere (for the periods 1901-2018, 1950-2018 and 1978-2018) and the annual course of the area of sea ice in the Northern Hemisphere (1 - offset of the annual course of insolation by 2 months in the past, 2 - offset of the annual course of insolation by 3 months in the past).
At the same time, in the case of a shift in the annual course of insolation by two months into the past, there is a closer correlation than with a shift of three months. So, for example, the number of values of R < -0.7 with an offset of two months in the past exceeds the number of corresponding values of R with an offset of the annual course of insolation for three months in the averaging range of 1901-2018 by 1,307 times, in the range of 1950-2018 by 1,177 times, in the range of 1978-2018 by 1,161 times. Also, the values of R increase from the averaging range of 1901-2018 to the range of 1978-2018. When the annual course of insolation is shifted two months into the past, the number of values of R < -0.7 obtained for the averaging range of 1978-2019 exceeds the corresponding number for the ranges of 1950-2018 and 1901-2018 by 1,006 and 1,048 times, respectively. When the annual course of insolation is shifted by three months, these values are 1,020 and 1,180, respectively.
When comparing the results of correlation of the annual course of the sea ice area with the average long-term annual course of insolation in the Northern Hemisphere (section 1) and the average long-term course of insolation in the corresponding 5-degree latitude zones (section 2), when the annual course of insolation is shifted by two months in the past, the amount of R < -0.7 increases for the range 1901-2018 by 1,051 three times. For the ranges of 1950-2018 and 1978-2018, these values are close (Tables 1, 2). Correlation with insolation in 5-degree latitudinal zones exceeds R values when correlated with the annual course of insolation of the Northern hemisphere in all time ranges. For example, the number of R values < -0.7 obtained from the annual course of insolation of 5-degree zones shifted two months into the past exceeds the values of R obtained by correlation with the average long-term annual course of insolation of the Northern hemisphere. in the range of 1901-2018 1,470, in the range of 1950-2018 1,389, in the range of 1978-2018 1,354 times. When the annual course of the insolation of 5-degree zones is shifted by three months, the exceedances are 1,177, 1,097 and 1,064 for the ranges of 1901-2018, 1950-2018 and 1978-2018, respectively.
As follows from the table 1 and 2 the number of values of the correlation coefficient < -0.9 increases from correlation calculations using the average long-term annual course of insolation of the Northern Hemisphere to the use of the average long-term annual course of insolation of 5-degree cells. In the range of 1901-2018 . the number of values of R < -0.9 increases (when the annual course of insolation is shifted by 2 months) by 4,673 times, in the range of 1950-2018 by 4,220 times, in the range of 1978-2018 by 3,979 times.
Conclusion
1.Based on the selected radiation criterion according to the obtained distribution of R, two regions are distinguished, different in the degree of reliability of the data presented (Fig. 5). One is pack, drifting ice with high negative values of R. The second is the coastal zone, in which there is practically no correlation (the zone of soldered ice, coastal - flaw lead and zapripaynye clearings). Weak (or absent) The correlation is observed over a significant length of the coastal zone in the Arctic Ocean, as well as in the straits and bays of the Canadian Arctic Archipelago. Weak correlation (or lack thereof) may be associated with both river runoff, sea ice drift and other factors that create a special environment for the formation and seasonal dynamics of sea ice in the coastal zone, reducing the reliability and reliability of ice information. Comparison of maps (fig. 5 c and d) shows that for a vast area of the central Arctic adjacent to Greenland from the north, verification and refinement of ice data is also probably required.
2. When correlating the average long-term annual course of the area of sea (pack) ice with the average long-term annual course of insolation in 5-degree cells, the R values are higher than when correlating with the average long-term annual course of insolation of the Northern hemisphere. Thus, the average long-term annual course of insolation in 5-degree latitudinal zones is a more reliable criterion for evaluating the array of ice data than the average long-term course of insolation of the entire Northern hemisphere. The closest relationship is observed when the average long-term annual course of insolation in the phase is shifted by 2 months into the past.
3.The correlation coefficient increases from the range of 1901-2018 to the range of 1978-2018. This reflects an increase in the reliability of the array data from the past to the present and the need to correct ice data in the early time range of the array (1901-1978). Early data on the area of sea ice can probably be refined and adjusted according to the insolation criterion studied in the work. This is possible by the interpolation method to increase and approximate the values of R to the values obtained for the period 1978-2018 by correlation with the average long-term annual course of insolation in 5-degree latitudinal zones, shifted 2 months into the past. Thus, the studied insolation criterion can be used to determine data problematic in terms of reliability for time ranges and areas in order to refine and correct them, which can contribute to improving the reliability and reliability of the HadISST data array.
This research was carried out in accordance with the state budget theme "Evolution, current state and forecast of development of the coastal zone of the Russian Arctic" (121051100167-1), "Danger and risk of natural processes and phenomena" (121051300175-4), "Evolution of the cryosphere under climate change and anthropogenic impact" (121051100164-0) and "Geographical foundations of sustainable development of energy systems using renewable energy sources" (121051400082-4).
References
|
1.
|
Zaks L. Statisticheskoe otsenivanie. M.: Statistika, 1976. 598 s.
|
|
2.
|
Fedorov V.M. Sistemy otscheta vremeni v geografii // Vestnik Mosk. Un-ta. Seriya 5, geografiya, 2002. ą 4. S. 21– 26.
|
|
3.
|
Fedorov V.M., Kostin A.A. Vychislenie insolyatsii Zemli dlya perioda ot 3000 g. do n.e. do 2999 n.e. // Protsessy v geosredakh, 2019. ą 2(20). S. 254–262.
|
|
4.
|
Fedorov V.M., Grebennikov P.B., Frolov D.M. Otsenka roli insolyatsionnogo faktora v izmenenii ploshchadi morskikh l'dov v rossiiskoi Arktike // Kriosfera Zemli, 2020. T. 24. ą 4. S. 38 – 50.
|
|
5.
|
Fedorov V.M., Grebennikov P.B. Mnogoletnie izmeneniya ploshchadi morskikh l'dov v Severnom polusharii v svyazi s izmeneniem kharakteristik insolyatsii // Kriosfera Zemli, 2021. T. 25. ą 2. S. 38–47 DOI: 10.15372/KZ20210204
|
|
6.
|
Shuleikin V.V. Fizika morya. M.: AN SSSR, 1953. 990 s.
|
|
7.
|
Berger A. Long-term variations of daily insolation and Quaternary Climatic Changes // Journal of Atmospheric Science, 1978. V. 35(12). P. 2362–2367.
|
|
8.
|
Borisenkov E. R., Tsvetkov A.V., Agaponov S.V. On some characteristics of insolation changes in the past and the future // Climatic Change, 1983. ą 5. P. 237–244.
|
|
9.
|
Cionco R.G., Soon W.W-H. Short-term orbital forcing: A quasi-review and a reappraisal of realistic boundary conditions for climate modeling // Earth-Science Reviews, 2017. V. 166. P. 206–222.
|
|
10.
|
Fedorov V.M. Interannual Variations in the Duration of the Tropical Year // Doklady Earth Sciences, 2013. V. 451. Part 1. P. 750–753. DOI: 10.1134/S1028334X13070015.
|
|
11.
|
Fedorov V.M. Trends of the changes in sea ice extent in the northern hemisphere and their causes // Kriosfera Zemli, 2015. V. XIX. ą 3. P. 46–57.
|
|
12.
|
Fedorov V.M., Frolov D.M. Spatial and temporal variability of solar radiation arriving at the top the atmosphere // Cosmic Research, 2019. V. 57. ą 3. Pp. 156–162. DOI: 10.1134/S0010952519030043
|
|
13.
|
Giorgini J.D., Yeomans D.K., Chamberlin A.B., Chodas P.W., Jacobson R.A., Keesey M.S., Lieske J.H., Ostro S.J., Standish E.M., Wimberly R.N. JPL`s On-Line Solar System Data Service // Bulletin of the American Astronomical Society, 1996. V. 28(3). P. 1158. http://www.metoffice.gov.uk/hadobs/hadisst/data/download.html http://ssd.jpl.nasa.gov
|
|
14.
|
Kopp G., Lean J. A new lower value of total solar irradiance: Evidence and climate sig¬nificance // Geophysical Research Letters, 2011. V. 37. L01706. DOI: 10.1029/2010GL045777.
|
|
15.
|
Rayner N.A., Parker, D.E., Horton E.B., Folland C.K., Alexander L.V., Rowell D.P., Kent E.C., Kaplan A. Global analyses of sea surface temperature, sea ice, and night marine air temperature since the late nineteenth century. J. Geophys. Res., 2003. Vol. 108, No. D14, 4407 10.1029/2002JD002670
|
|


 Cn
Cn


